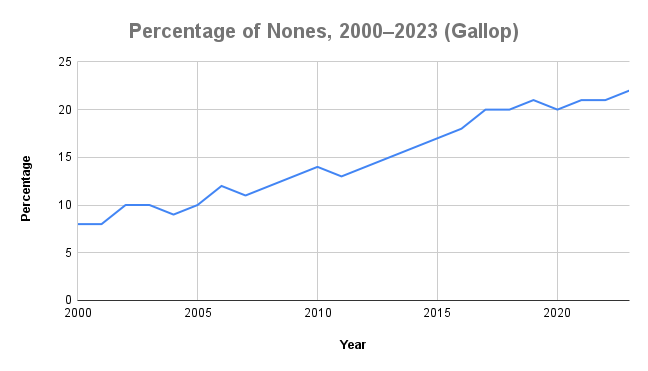
Quick Data: Has the growth of Nones leveled off?
Survey says ... maybe? Or at least slowed?

In spring of 2018, I was working on a visualization for my final project in a course on metacognition. To contextualize my project, I needed to give the religiously diverse students in my class a snapshot of trends in U.S. religious affiliation.
I couldn't find a visualization I liked, so I made one.
The original visualization
I stumbled across the animation today as I worked through my weekly course prep. That's because I reused it for the week when students engage significantly with Elizabeth Drescher's Choosing Our Religion, plus some other resources about secularization and affiliation in the U.S. context.
When I went to do a little update to the graphic, I a little surprised by what I found. Here's the updated version as a GIF.
In short, the growth rate of religiously unaffiliated people as a group has slowed from the rate we saw in the '10s. Between 2009 and 2017, the percentage of Nones in the Gallup data went from 13% to 20%, almost a percentage point change each year. But from 2018 to 2023, the percentage went from 20 to 22%, a rate less than half that fast.
It looks like Pew's verdict on this trend is that it's too early to say in any definite way what might be happening, which I think is right. (By the way, it's a different survey, so they have different numbers—presumably due to how they ask the question and what options they give for the answer.)
But for those of us with a professional interest in these numbers, who had perhaps come to take the Nones' rapid, rapid growth as something of a given, this certainly seems like some kind of change from what I, at least, had internalized as the status quo.